
I Replaced My Slides With Code, and My Students Learn Differently Now
I moved my hydraulics and thermodynamics teaching from slide decks to lessons built in HTML, CSS and three.js, with PDFs for printing. What I built, what changed, and how to set it up yourself with Claude, even without a domain.
Tom Cohen · · 9 min read
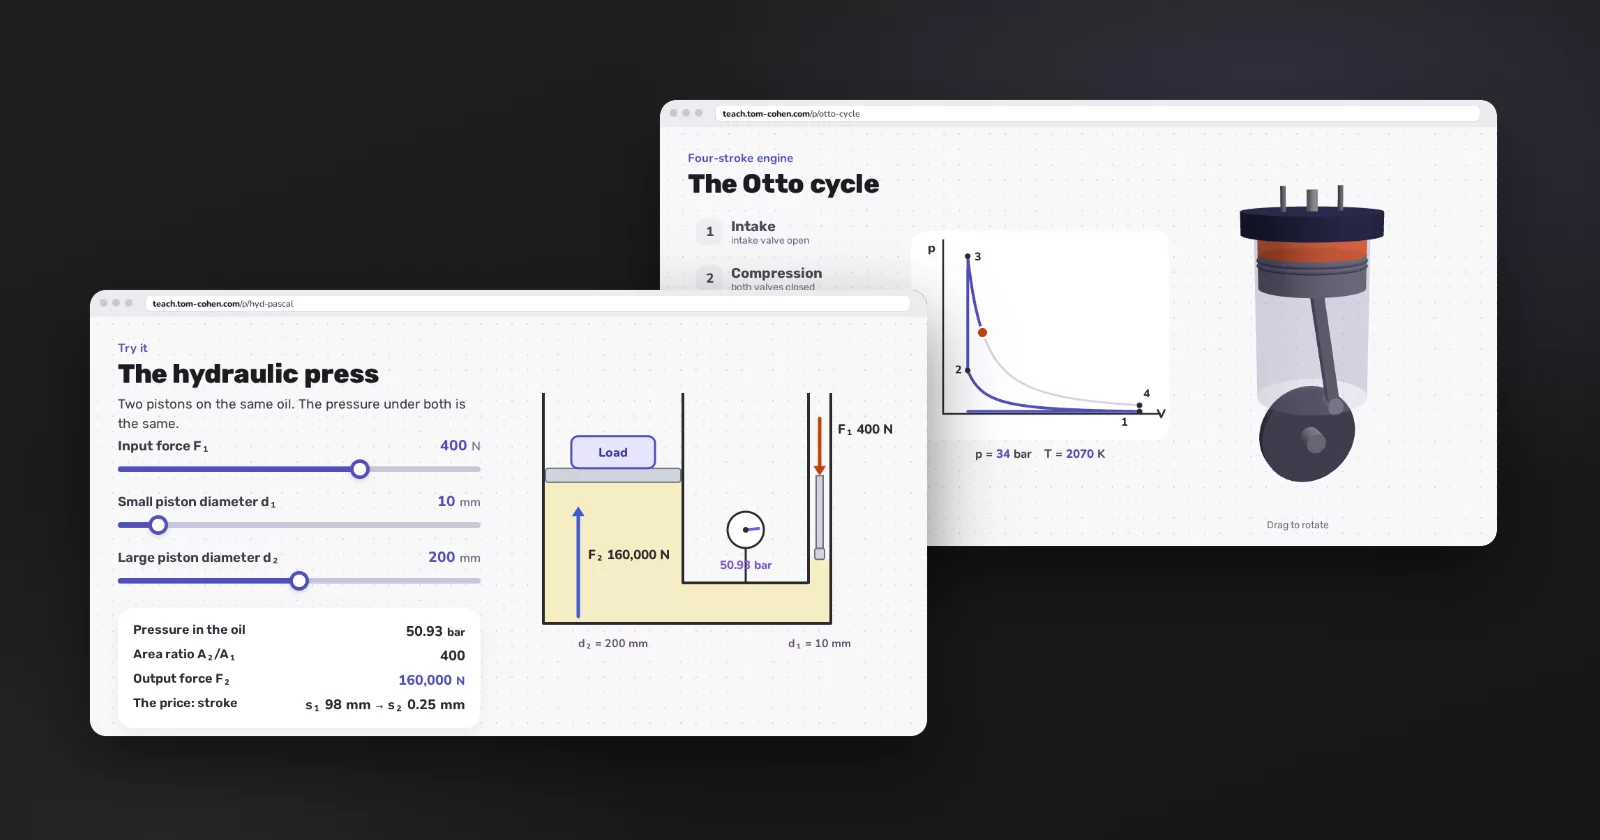
I teach hydraulics and thermodynamics to practical engineering students. Until this week, every lesson I taught was a slide deck.
Now my teaching lives on teach.tom-cohen.com, and there are no slides on it. Every lesson is a web page built from HTML, CSS and three.js. Students can push a piston, turn an engine, and drag a slider to watch the numbers change. Every lesson also prints to a clean PDF for anyone who wants it on paper.
I built the site and moved two courses onto it in two days, November 16 and 17, working with Claude. It has already changed how I teach and how my students learn.
The short clips in this post were made the same way the lessons were: HTML, CSS and three.js, rendered frame by frame so they look like screen recordings.
What slides couldn’t do
Most of what I teach is a relationship between quantities. Pascal’s law isn’t “the pressure is 6.37 bar”. It’s that the pressure under both pistons is the same. So when you make the small piston smaller, the output force grows, and you pay for it in stroke.
A slide shows one case of that. To show the relationship, I’d talk over the slide, draw on the board, or copy the slide with different numbers and hope I updated every copy.
Copies also hide mistakes. When I moved the Pascal lesson over, Claude noticed that one of my old slides gave the piston area as A = πd². The area is πd²/4.
What a lesson looks like now
Each lesson is a presentation made of scenes. A scene has build steps, like a slide with clicks. But it’s code, so it can do anything a web page can:
- Diagrams that draw themselves, step by step, in the order I’d explain them.
- Simulations with sliders. Change a diameter and watch the force, the pressure gauge and the stroke update together.
- 3D in three.js. A four-stroke engine you can rotate, and a buoy and a beam floating in water.
- Notes written for students. On a phone, a lesson opens in reading mode: every scene, with its explanation under it.
- One source for the physics. Every number on screen comes from one physics file per lesson, and that file has tests. A slider can’t show a number the formulas disagree with.
The hydraulics course
Hydraulics moved first, and it’s the biggest course on the site. It’s for practical engineering students who have done basic physics and math:
- Six units: introduction, hydrostatics, hydrodynamics, hydraulic systems, home experiments and appendices.
- 26 presentations with 335 scenes. They run from fluid properties and pressure, through Bernoulli, Venturi and Pitot, Reynolds, head losses and pumps, to valves, cylinders and circuits in industry.
- A circuit simulator for 4/2 and 4/3 directional valves, relief valves and check valves. Students read a hydraulic drawing, then watch it run.
- Buoyancy in 3D. One exam-style question about a buoy, a beam and a weight, solved part by part with free-body diagrams. Students change densities and sizes and see what floats.
- Experiments with things from home: a kitchen scale for Archimedes, two syringes as a hydraulic press, a bottle with holes for Torricelli, a garden hose for continuity and Reynolds, a hair dryer and a ping-pong ball for Bernoulli, and the phone’s pressure sensor to measure the height of a building.
- A formula sheet and a question map. The map links every practice question in our shared Drive folder to the lesson it belongs to.
The thermodynamics course
In thermodynamics I started with the unit students find hardest: piston engine cycles.
- Four presentations: heat engines and the four-stroke engine, the Carnot cycle, the Otto cycle and the Diesel cycle.
- A 3D engine in three.js. The piston, rod and crank move, the valves open on the right strokes, and the gas changes colour with its temperature. Next to it, the p-V diagram draws itself as the cycle runs.
- Final-exam questions on engine cycles from 1996 to 2021, as they appeared.
- Three tests built around a story: a greenhouse in the Arava that opens its own roof vent, a refrigerated truck taking ice cream to Eilat, and a diving bell in the Red Sea. Each has a full solution with explanations, as a web page and as a PDF.
Printing still matters
Some students study on paper, and tests are taken on paper. So every lesson and every test prints.
There’s no PDF server behind it. Each page has a print stylesheet: the site’s header and buttons disappear, worked solutions open, presentations print one scene per page at 16:9, and tests print on A4. The PDF button opens the browser’s print dialog, and the reader picks “Save as PDF”.
The impact
Explanations got better. A scene builds an idea in the order I’d explain it in class, and the notes under it are written for the student, not for me. A student who missed a lesson reads the same explanation the class heard.
The visuals are clearer. Each scene holds one idea, with a diagram that draws itself and real numbers. The walls of text that used to fill my slides are gone.
The 3D and the simulations click. Pascal, Bernoulli and the Otto cycle land faster when students can push a piston or turn an engine and see what happens.
Students study on their phones. Reading mode turns every lesson into a scrolling page, with the explanation under each scene.
They print what they need. Tests, solutions and the formula sheet go on paper when that’s how a student works.
It’s fast to make. A new lesson is a conversation with Claude and a careful review, much faster than building it in Google Slides. Changing an example before class takes minutes.
How it gets made
I don’t write the scenes by hand. I give Claude the material, usually an old deck exported to PDF, exam questions or my notes, and a short brief. Claude reads the project’s rules, writes the physics first with tests, then the scenes and the notes, and opens a preview.
My part is the teaching: what goes into the lesson, in what order, which example, and where students usually get stuck. I check every number, read every note, and teach from it. When something is off, I say so and Claude fixes it.
What makes this work isn’t one clever prompt. The project itself tells Claude how I teach. My repository has a CLAUDE.md file with the rules (Hebrew first, right-to-left layout, the design, “every number comes from the physics file”) and a few skills, which are step-by-step playbooks for a new presentation, course material, and publishing.
How to set it up yourself
You don’t need my stack. My site is a Next.js app with its own presentation engine, but a folder of HTML files gets you most of the way. Here’s the shortest path.
1. Install Claude Code and make a folder
Install Claude Code, make a folder for your course, and start Claude in it:
mkdir my-lessons && cd my-lessons
git init
claude
Git isn’t required, but it keeps a history of every change, and free hosting usually deploys from it.
2. Tell Claude how you teach, in CLAUDE.md
Claude reads CLAUDE.md at the start of every session. Write your rules there once, instead of repeating them in every prompt:
# My lessons

Lessons for <course> students. Each lesson is one HTML file: site/<course>/<lesson>.html

- Plain HTML, CSS and JavaScript. three.js from a CDN when a lesson needs 3D.
- A lesson is a list of 16:9 scenes. One idea per scene. Arrow keys reveal the steps.
- Under every scene, a note written for the student, not for me.
- Every number on screen comes from the lesson's physics.js. Write it first, with checks.
- SI units. g = 10 m/s² unless a question says otherwise.
- Printing: site/print.css. One scene per page at 16:9; tests on A4. No buttons on paper.
- Language: <yours>. Calm, plain wording. No emoji.
3. Turn the steps you repeat into a skill
A skill is a playbook Claude loads when a task matches it. Create .claude/skills/new-lesson/SKILL.md:
---
name: new-lesson
description: Create or change a lesson in site/. Use when I ask for a lesson, slides, a simulation or a test.
---

1. Read the source I give you (a PDF of old slides, exam questions, notes).
   List what the lesson must cover, and ask me if anything is unclear.
2. Write physics.js and run its checks with node.
3. Write the scenes, starting from site/_template.html.
4. Open the lesson and its print preview. Fix overflow and text that is too small.
5. Tell me what you changed from the source, and why.
4. Give it your old material and ask for one lesson
Export a deck from Google Slides or PowerPoint as a PDF, put it in the folder, and ask:
Turn slides/pascal.pdf into a lesson. Keep my order and my examples. Add a simulation where the student changes the small piston’s diameter and sees the force.
Open the file in a browser, teach from it once, and tell Claude what to change. The second lesson goes faster, because the template, the stylesheet and the rules already exist.
5. Make it print
The PDF button can be <button onclick="window.print()">PDF</button>, plus a print stylesheet:
@media print {
  @page { size: 1280px 720px; margin: 0; } /* slides; use A4 for tests */
  .scene { break-after: page; }
  nav, button, .no-print { display: none; }
  * { print-color-adjust: exact; }
}
The reader picks “Save as PDF” in the print dialog. No server, no PDF library.
6. Publish it, even without a domain
Static files can be hosted for free, at an address you don’t have to buy:
- Cloudflare Workers. Add a
wrangler.jsoncand runnpx wrangler deploy. You gethttps://<name>.<your-subdomain>.workers.dev. This is what I use, with my own domain on top. - GitHub Pages. Push the folder to GitHub and turn on Pages in the repository settings. You get
https://<user>.github.io/<repo>.
{
  "name": "my-lessons",
  "compatibility_date": "2026-11-01",
  "assets": { "directory": "./site" }
}The first time, npx wrangler login connects your Cloudflare account. After that, ask Claude to deploy when you’re ready, or connect the repository in the Cloudflare dashboard so every push publishes.
What still takes work
- Checking. Claude caught a mistake in my slides, and it can make its own. I check every number and every note before I teach from it. The physics file and its tests make that much easier.
- Judgment. Claude builds what I ask for. Deciding what deserves a simulation, and when a plain picture with an arrow is better, is still my job.
- Small screens. A 16:9 scene is small on a phone, so there the notes under each scene carry the explanation.
Where to see it
It’s all public at teach.tom-cohen.com. Start with the hydraulics course or the thermodynamics course. The lessons are in Hebrew.
If you teach and want to try this with your own course, start with one lesson. That’s enough to see whether it changes your class too.